The client’s background
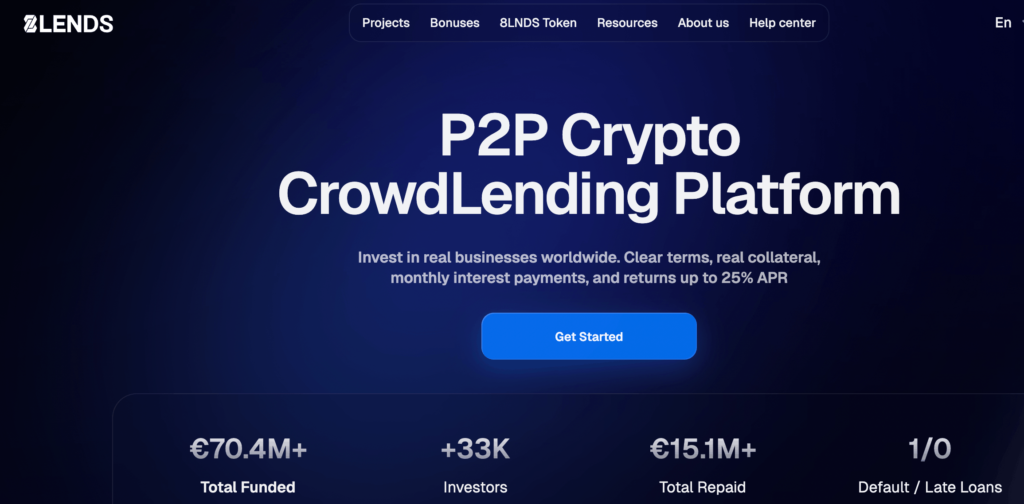
8Lends is a crypto lending platform that connects borrowers and lenders for fast, collateralized crypto loans. The client’s paid acquisition goal was to generate high‑intent registrations that convert to deposits, build audience pools for remarketing, and identify high‑LTV pockets for future scaling.
Campaign objective
- Objective: Acquisition — registrations that convert to deposits (paid conversions) and audience building for remarketing/Lookalikes.
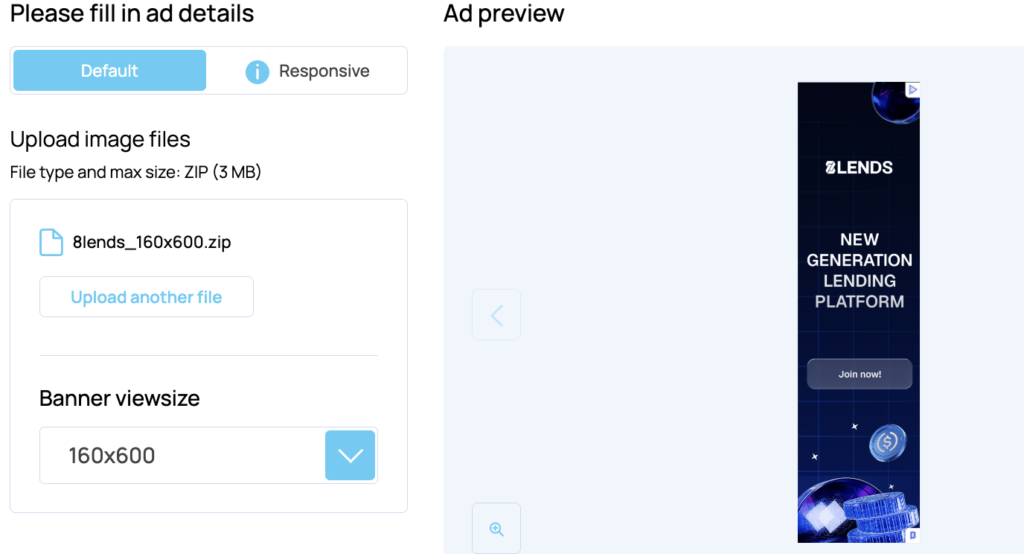
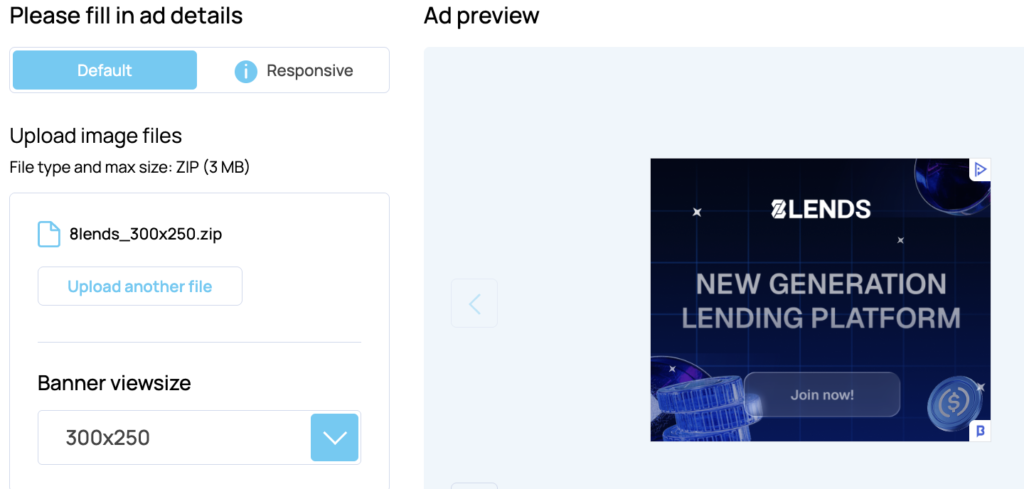
- Creative: HTML5 banners in five sizes: 300×250, 160×600, 320×100, 468×60, 728×90.
- Geo: Portugal, Spain, France (tests in UK, Germany, Italy, Turkey).
- Campaign period: 19 Aug 2025 — 08 Oct 2025.
Campaign preparation — step‑by‑step
- Define the objective
Primary: acquire registered users who make deposits.
Secondary: build audiences for retargeting and create high‑value lookalikes for scale.
- Geo and audience segmentation
Priority markets: Portugal (scale), Spain (test high‑LTV), France (test/scale).
Audience targets:
- crypto wallets/traders, DeFi interest, passive income seekers;
- age 25–45;
- mobile‑first but include desktop for high‑LTV funnels.
- Creative format and messaging
Banner format: HTML5 animated banners to increase engagement. Use sizes: 300×250, 160×600, 320×100, 468×60, 728×90.


Messaging: 2–3 core messages (easy loans, fast payouts, competitive rates). Localize copy for PT/ES/FR.
For the best results, designers should produce GEO‑specific creatives for each market (PT, ES, FR, GB, DE). Use fully localized copy (native language and idioms), localized imagery and culturally appropriate trust signals (local partners, language-specific testimonials). Additionally, test multiple tonalities per market:
- direct promotional (clear CTA and offer),
- trust‑focused (partners, security, reviews),
- an experimental “heritage / antique” aesthetic (a stylized, heritage look and feel that can attract attention in certain segments).
Test matrix: minimum 3 creative variants per market (A/B/C) — e.g., promotional CTA, trust/credentials CTA, product benefit CTA.
- Landing pages & UX
Create localized landing pages for PT/ES/FR with fast load times (target ≤2.5s mobile).
Include short registration, clear deposit steps/KYC explanation, trust signals (partners, reviews), and visible incentives.
Ensure mobile UX is optimized for conversions.
- Tracking & attribution
Add UTM parameters to all creatives.
Implement client‑side + server‑to‑server postback to capture deposit events and pass click ID to Bitmedia (ConversionValueUSD macro for value tracking).
Confirm tracking end‑to‑end with test clicks and postback verification.
- Budgeting & bidding strategy
Start with low daily caps per country for testing (e.g., $5–50/day).
KPIs in testing: registration CVR, deposit CVR (deposits/registrations), avg deposit.
Scale budgets and move to value‑based bidding after winners are identified.
- Fraud prevention & traffic quality
Implement bot/fraud detection, block suspicious publishers, and monitor unusual patterns (IP clusters, instant deposits, repeat low‑quality sessions).
Monitor session duration, bounce rate, conversion patterns and implement block lists if needed.
- QA & pre‑launch checks
Validate creatives in all sizes and browsers, confirm redirects and UTMs.
Test conversion flow: test click → registration → deposit → postback appears in conversion logs.
Check localizations, legal disclaimers, and compliance copy.
- Launch & optimization cadence
Launch parallel small tests per country.
First 72 hours: observe traffic quality, immediate fraud signals.
Day 7–14: identify top creatives, sources, and placements; scale winners and pause underperformers.
Continuous: iterate on landing pages and creatives, run lookalike campaigns from depositors.
- Reporting & post‑campaign analysis
- Daily: health metrics (impressions, clicks, CTR, registrations).
- Weekly: funnel metrics (registrations → deposits → avg deposit), top sources by deposit rate.
- Post‑campaign: attribute value, calculate cohort LTV if possible, analyze outliers, and lessons for next round.
The campaign results:
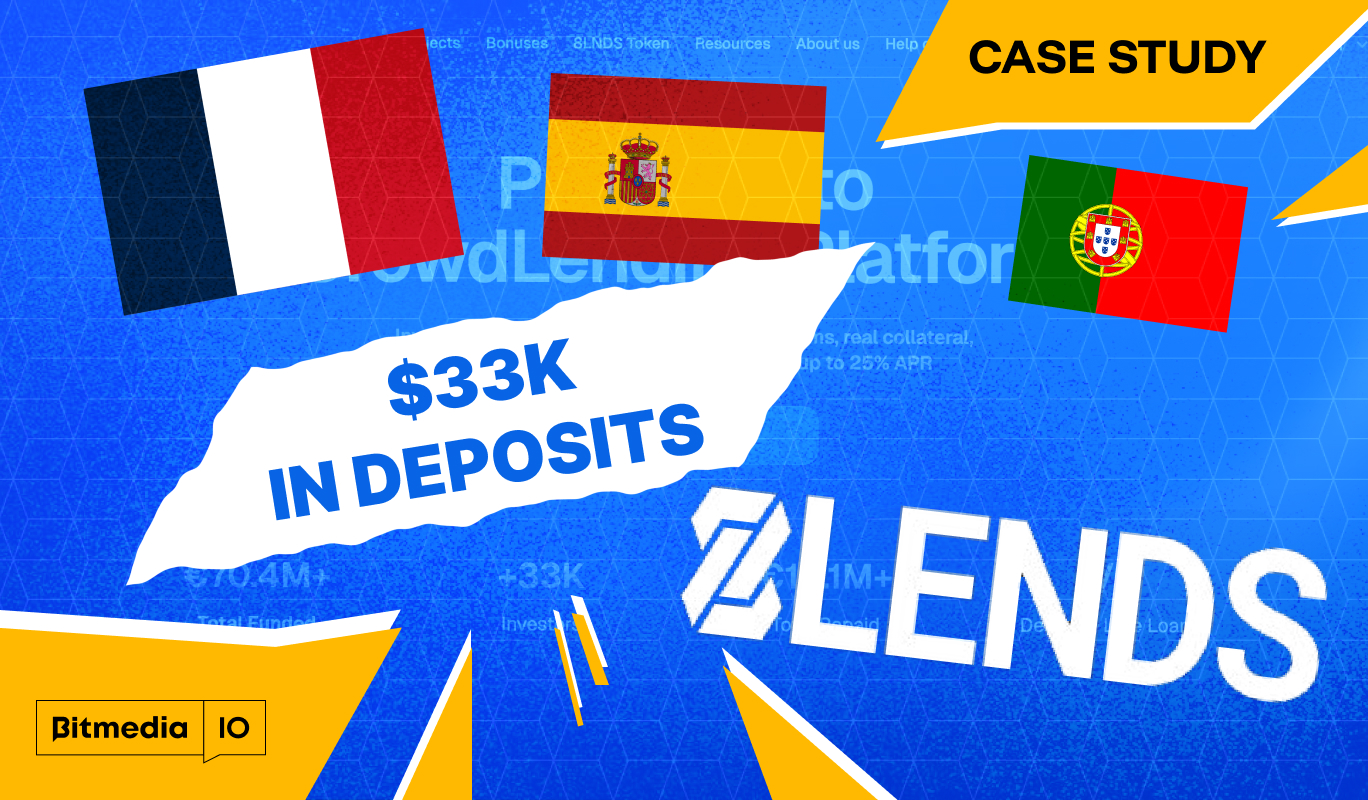
Key outcome: 39 deposit events from 29 unique depositors, totaling $33,910 in deposits; Portugal produced the highest count, and Spain produced the single largest deposit ($20,000).
| Metric | Value |
|---|---|
| Total deposit events | 39 |
| Unique depositors | 29 |
| Total deposit volume | $33,910 |
| Avg deposit per event | ≈ $869 (skewed by $20K outlier) |
| Avg deposit per unique depositor | ≈ $1,169 |
| Largest single deposit | $20,000 (Spain) ~59% of total volume |
| Portugal (deposits → amount) | 28 → $12,035 (~35% of total) |
| France (deposits → amount) | 8 → $1,775 (~5% of total) |
| Spain (deposits → amount) | 3 → $20,100 (~60% of total) |
Campaign-level performance
| Metric | Value |
|---|---|
| Total impressions (devices) | 6.4M (Desktop 4.5M + Mobile 1.9M) |
| Total clicks | 7.8K (Desktop 2.2K + Mobile 5.6K) |
| Total spend | $2,631.54 (Desktop $731.54 + Mobile $1,900) |
| Overall CTR | ≈ 0.12% (7,800 / 6,400,000) |
| Overall average CPC | ≈ $0.34 ($2,631.54 / 7,800) |
Campaign-level insights:
- Reach & engagement: 6.4M impressions and 7.8K clicks demonstrate strong market exposure across the test window.
- Efficiency: overall CTR ≈0.12% (display benchmark range varies) and average CPC ≈$0.34 – CPC is cost‑effective for crypto display buys.
- Acquisition economics: ad spend ≈$2.63K produced 39 deposit events (cost ≈$67.5 per deposit) and $33.9K in deposit volume – a promising deposits‑to‑ad‑spend ratio (~12.9×), though deposits ≠ revenue.
Verdict: campaign shows efficient paid traffic (low CPC) and strong reach, with cost per deposit at an attractive level relative to deposit amounts; final ROI depends on net revenue per deposit (fees/LTV).
Country performance
- France: 1.6M imp → 1.5K clicks → $387.56 → CTR ≈ 0.094% → CPC ≈ $0.26
- Italy: 1.1M imp → 1.4K clicks → $347 → CTR ≈ 0.127% → CPC ≈ $0.25
- Spain: 909.5K imp → 1.2K clicks → $495.94 → CTR ≈ 0.132% → CPC ≈ $0.41
- Portugal: 810.9K imp → 945 clicks → $376.48 → CTR ≈ 0.117% → CPC ≈ $0.40
- UK: 552.8K imp → 957 clicks → $369.59 → CTR ≈ 0.173% → CPC ≈ $0.39
- Germany: 854.3K imp → 891 clicks → $348.06 → CTR ≈ 0.104% → CPC ≈ $0.39
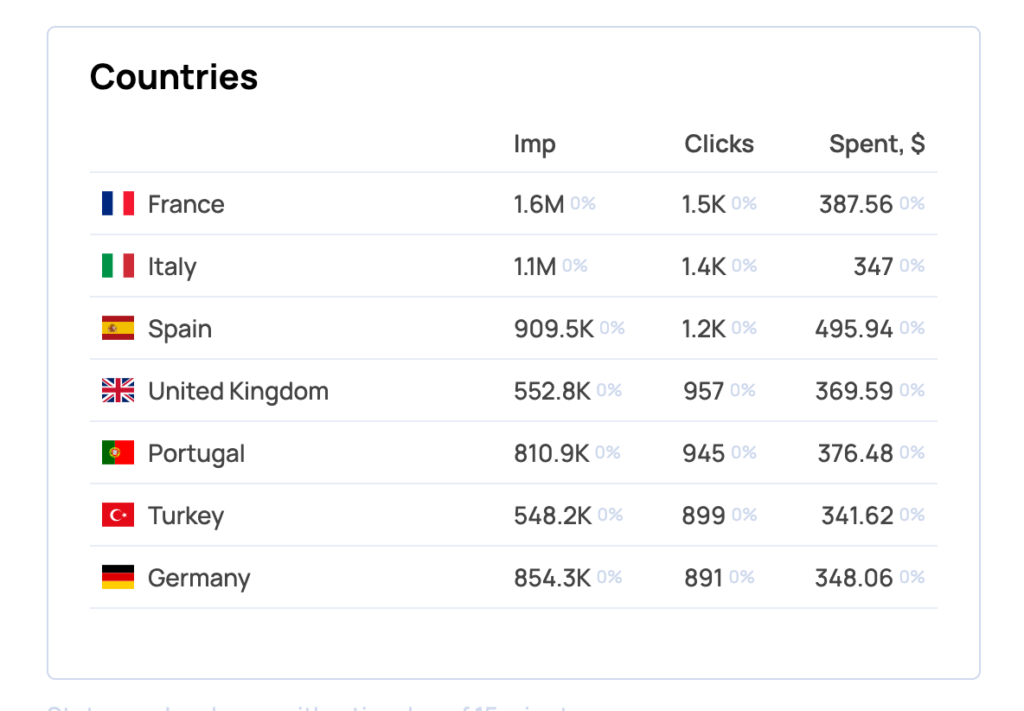
Country/GEO insights:
Portugal – strong volume driver (≈810.9K imp, 945 clicks, $376.48 spend) and the primary source of deposit events; good market for scaling.
Spain – moderate impressions (≈909.5K) with higher spend ($495.94) and fewer deposits, but produced the single $20K high‑LTV conversion — high strategic value to investigate and replicate.
France (and Italy, Germany, UK) – large reach (France ≈1.6M imp) with stable click activity; useful for reach and testing, but lower deposit share in the recorded deposit dataset.
Verdict: geo mix is healthy — Portugal for volume, Spain for high‑value tests, and larger markets (France/Italy/DE/UK) for scale and audience building.
Device-level performance
Mobile: 1.9M impressions → 5.6K clicks → $1,900 spend; CTR ~0.295% (much higher than desktop) and drove the majority of clicks.
Desktop: 4.5M impressions → 2.2K clicks → $731.54 spend; CTR ~0.049% (much lower), but desktop may feed higher‑LTV funnels.
Verdict: mobile is the primary driver of engagement and should be optimized for conversions; desktop can be maintained for higher‑value user flows and QA.
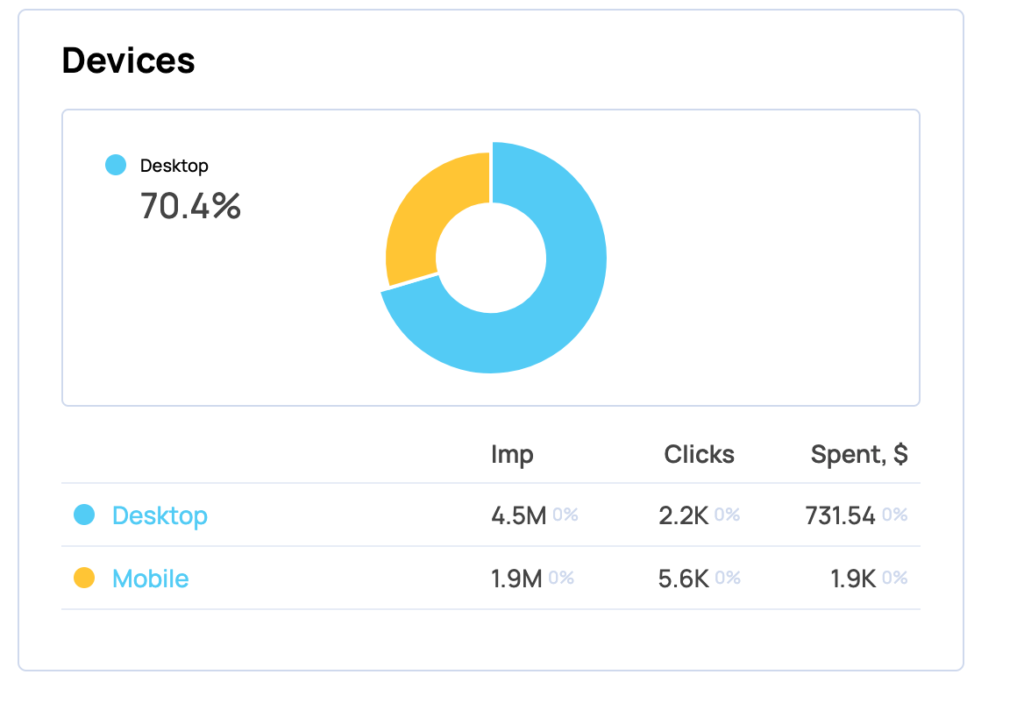
Mobile delivered far higher click throughput and a much higher CTR (0.295% vs 0.049%), and accounted for most of the clicks and spend. CPC is similar across devices, but mobile drives the bulk of engagement – optimize creatives and landing UX for mobile-first conversions while maintaining desktop targeting for high‑LTV funnels.
Creative performance
- Creo S1 (blue): 535.6K → 719 → $273.22 → CTR ≈ 0.134% → CPC ≈ $0.38
- Creo S1 (yellow): 335.5K → 526 → $199.88 → CTR ≈ 0.157% → CPC ≈ $0.38
- Creo S5: 746.2K → 766 → $191.50 → CTR ≈ 0.103% → CPC ≈ $0.25
- Creo S3 (blue): 326.6K → 393 → $157.20 → CTR ≈ 0.120% → CPC ≈ $0.40
- Creo S3 (green): 454.8K → 623 → $155.75 → CTR ≈ 0.137% → CPC ≈ $0.25
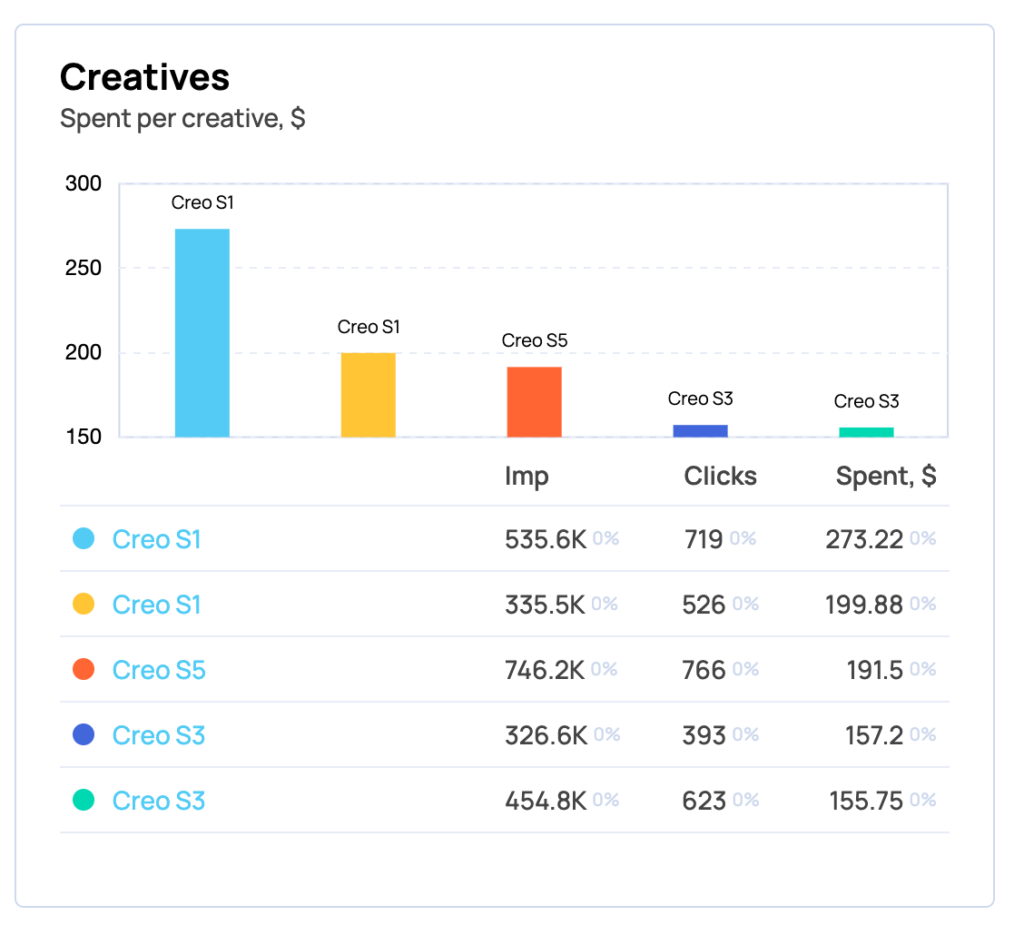
Creative insights:
- Best CTR: Creo S1 (yellow) ≈ 0.157% – strong engagement per impression and a good candidate for scaling creative tests.
- Best cost efficiency (lowest CPC): Creo S5 and Creo S3 (green) at ≈ $0.25 per click.
- Highest impressions: Creo S5 (746K) and S1 (535K) – good reach.
Verdict: mix of high‑CTR and low‑CPC creatives gives flexibility – scale S5/S3 for efficient clicks and push S1 variants to try lifting conversion rates.
Campaign spend by region
- Spain: 727,459 imp → 1,015 clicks → $415.30 → CTR 0.14% → CPC $0.41
- France: 1,522,673 imp → 1,444 clicks → $361.00 → CTR 0.09% → CPC $0.25
- Portugal: 756,275 imp → 890 clicks → $358.88 → CTR 0.12% → CPC $0.40
- Germany: 854,301 imp → 891 clicks → $348.06 → CTR 0.10% → CPC $0.39
- UK: 497,379 imp → 905 clicks → $352.95 → CTR 0.18% → CPC $0.39
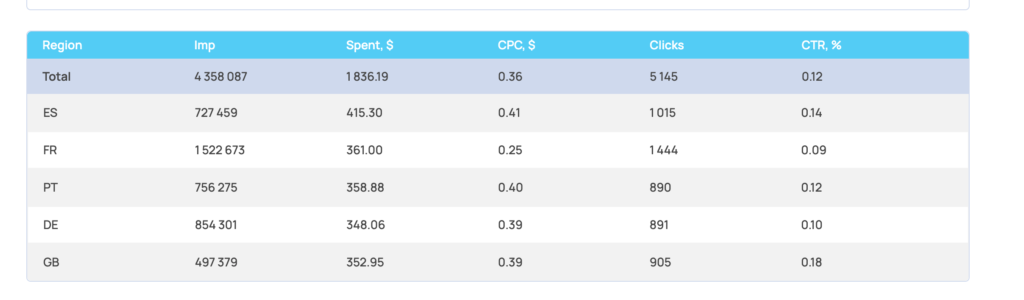
Regional insights
- France (FR). Volume + low CPC, low engagement: FR delivered the most impressions and clicks at the lowest CPC ($0.25), but CTR is low (0.09%). Interpretation: the supply is inexpensive, but creative or message relevance is weak. Action: improve ad relevance and LP experience in FR to convert cheap reach into quality clicks and downstream conversions.
- Portugal (PT). Proven volume and deposit source: PT shows a solid CTR (0.12%) and aligns with previous deposit data, in which Portugal drove the majority of deposit events. Interpretation: high-quality mid-ticket volume – priority scale market.
- Spain (ES). Moderate CTR, highest spend: ES has CTR 0.14% and the largest spend per region ($415.30). Although deposits were fewer historically, Spain produced the single $20K deposit – a strategic high-LTV opportunity. Action: investigate the high-LTV path in Spain, then run targeted replication tests.
- United Kingdom (GB). Best CTR: GB has the highest CTR (0.18%) with decent click volumes and mid-level CPC. Interpretation: creatives/placements perform well here – consider scaling for quality traffic.
- Germany (DE). Average performance: moderate CTR (0.10%) and CPC ~$0.39, worth localized creative testing to lift engagement.
Conclusions
This HTML5 banner campaign for 8Lends demonstrated that a focused, localized approach can deliver both steady volume and occasional high‑value conversions: 39 deposit events from 29 unique users produced $33.9K in deposits. The results underline two clear opportunities – scale proven volume in Portugal while investigating and replicating the Spanish high‑LTV funnel – and highlight the importance of multi‑size HTML5 creatives, localized landing pages, and robust postback tracking.
How can Bitmedia help you replicate and improve these results?
Bitmedia can design and run a full end‑to‑end campaign for your project, from strategy to scale. Our services include:
- Campaign strategy & geo/audience planning according to your goals.
- Production of custom HTML5 banners (multi‑size, localized variations) and creatives.
- Localized landing page recommendations and CRO guidance.
- Full tracking & attribution setup (UTMs, client + server postbacks, ConversionValueUSD).
- Fraud protection and traffic quality monitoring.
- Continuous optimization – A/B testing, lookalike builds, and value‑based bidding.
- Clear reporting and post‑campaign analysis with actionable recommendations.
Ready to scale? Contact your Bitmedia account manager or visit Bitmedia.io to get a custom proposal and creative brief. We’ll build a test plan, produce creatives, and optimize toward the users and deposit value that matters most to your business.
Related Posts