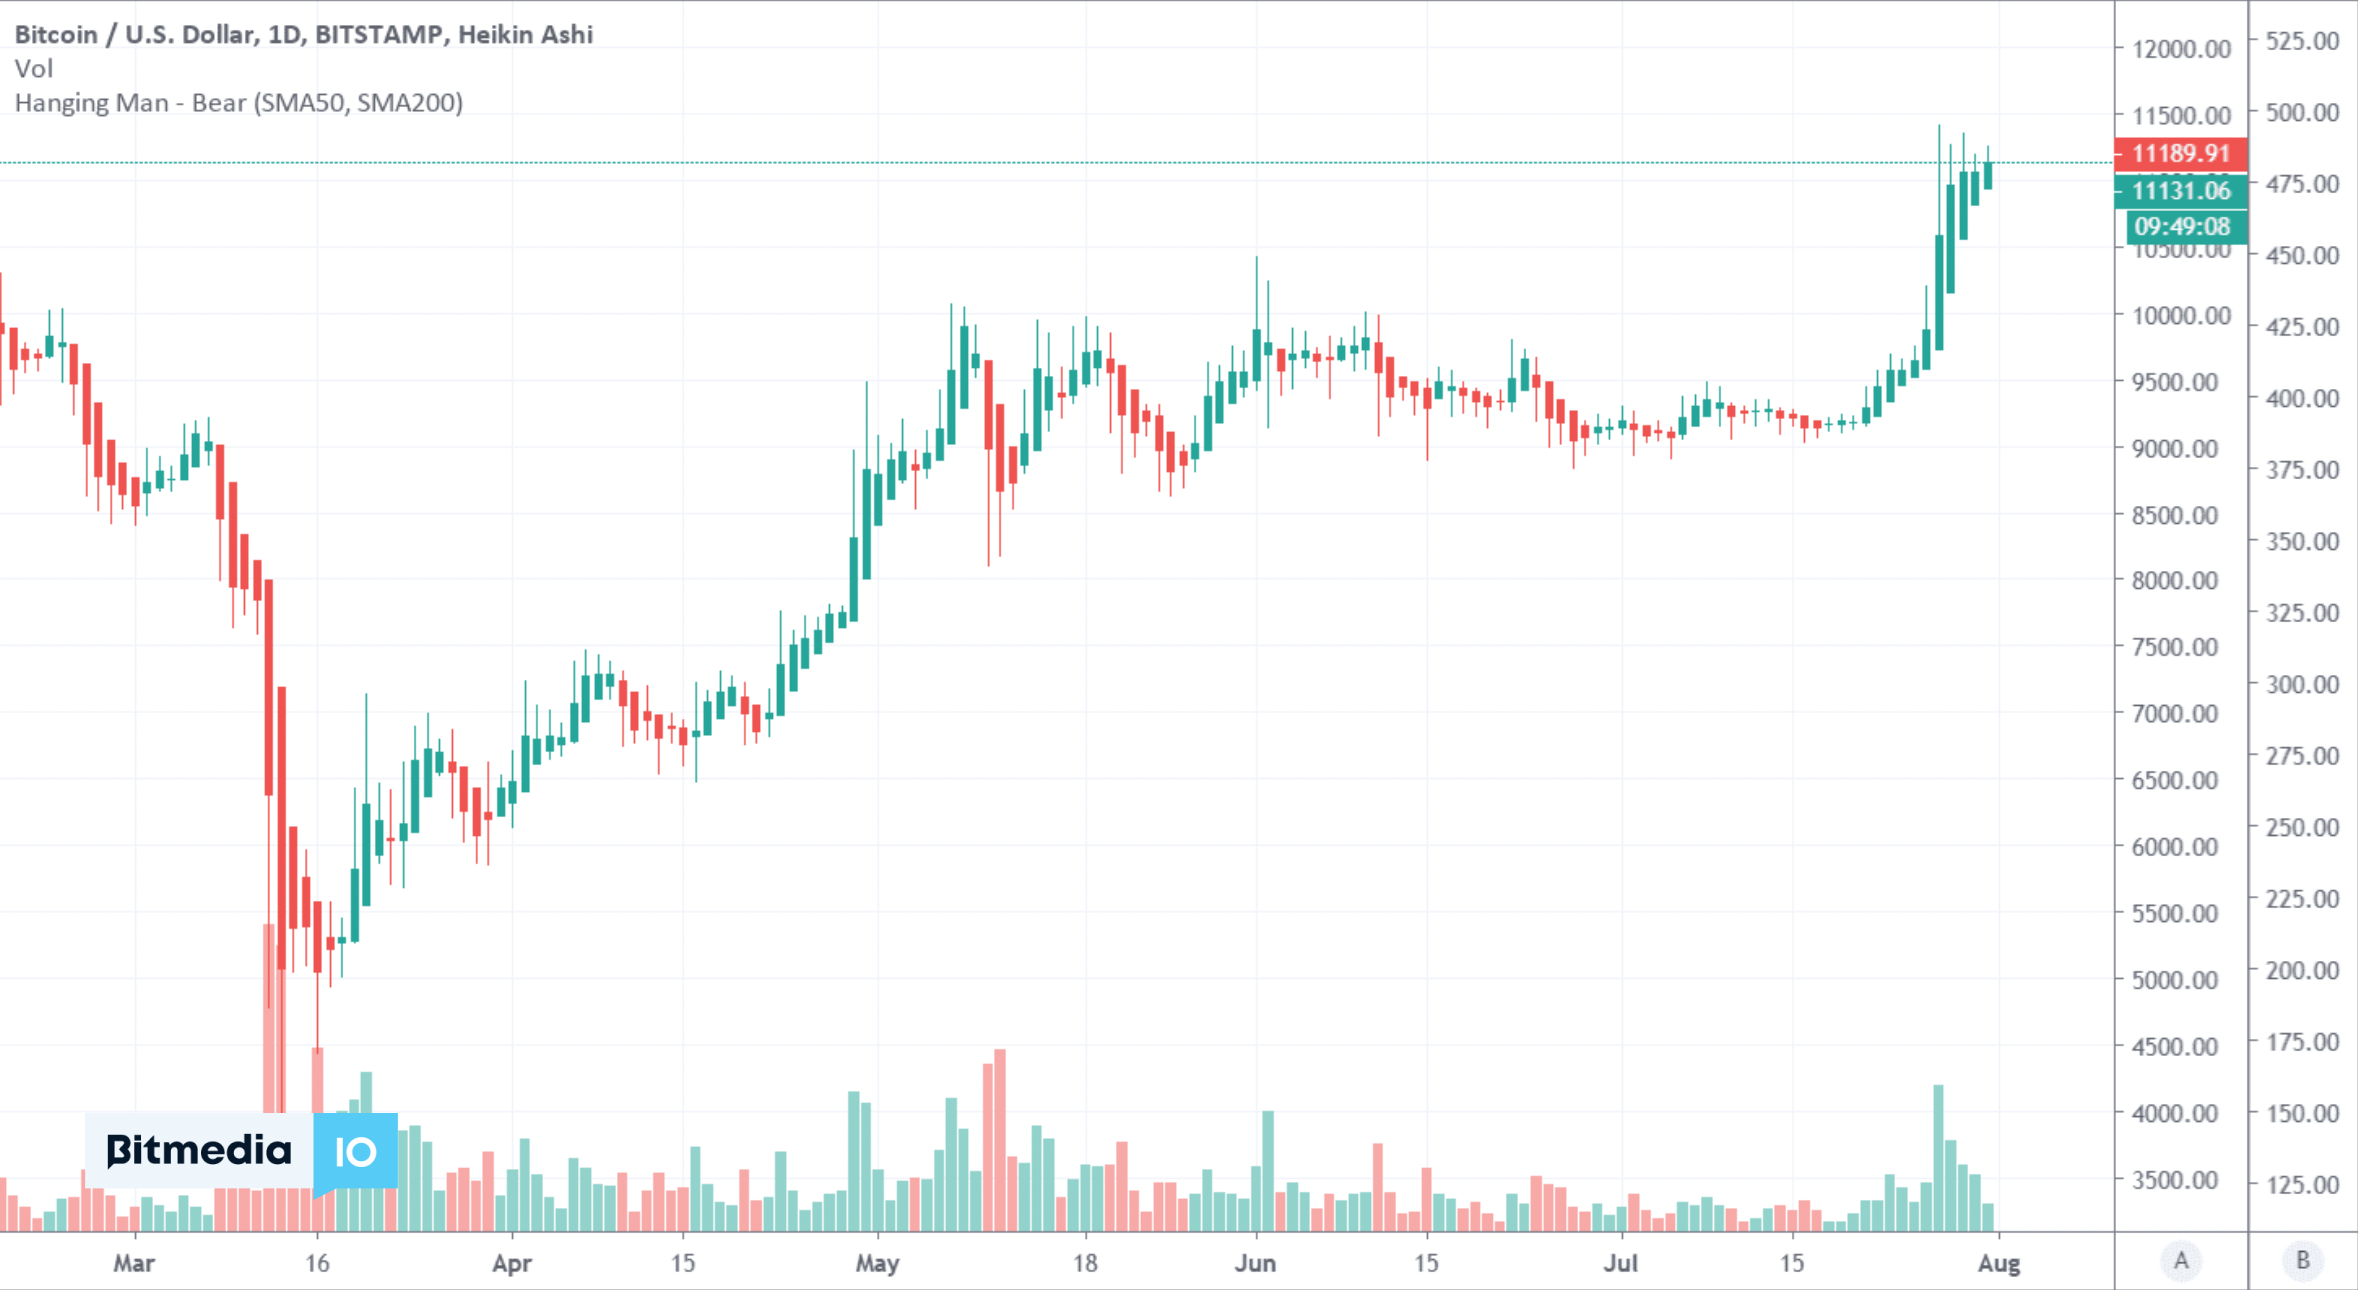
Bitcoin bear markets are brutal things, but for those who know how to navigate them, they spell out one thing – opportunity. However, with Bitcoin bear markets tending to be years in length, how can we tell when we are at a market bottom and it’s time to start making the most of them? There are a few signs to look out for, such as when nobody is talking about Bitcoin at all, but there are far more tangible signs we can look for in order to identify when a Bitcoin bear market is coming to an end. And for this, we need on-chain analysis.
On-chain analysis may sound scary to the uninitiated, but it’s not – it is simply a way of using the data surrounding cryptocurrency price action to plot charts that help us visualize how that coin is performing over a longer period of time. Once you understand on-chain analysis (which we’re about to help you with) you’ll be able to make much more informed decisions about when to get back into the market during a crypto winter.
We have identified three Bitcoin chart analysis tools you can use to work out whether the Bitcoin bear market has ended, crypto indicators that will give you a head start over anyone who doesn’t use them.
- (MVRV) Z-Score
The first is of these cryptocurrency indicators is the Market value to realised value (MVRV) Z-Score:
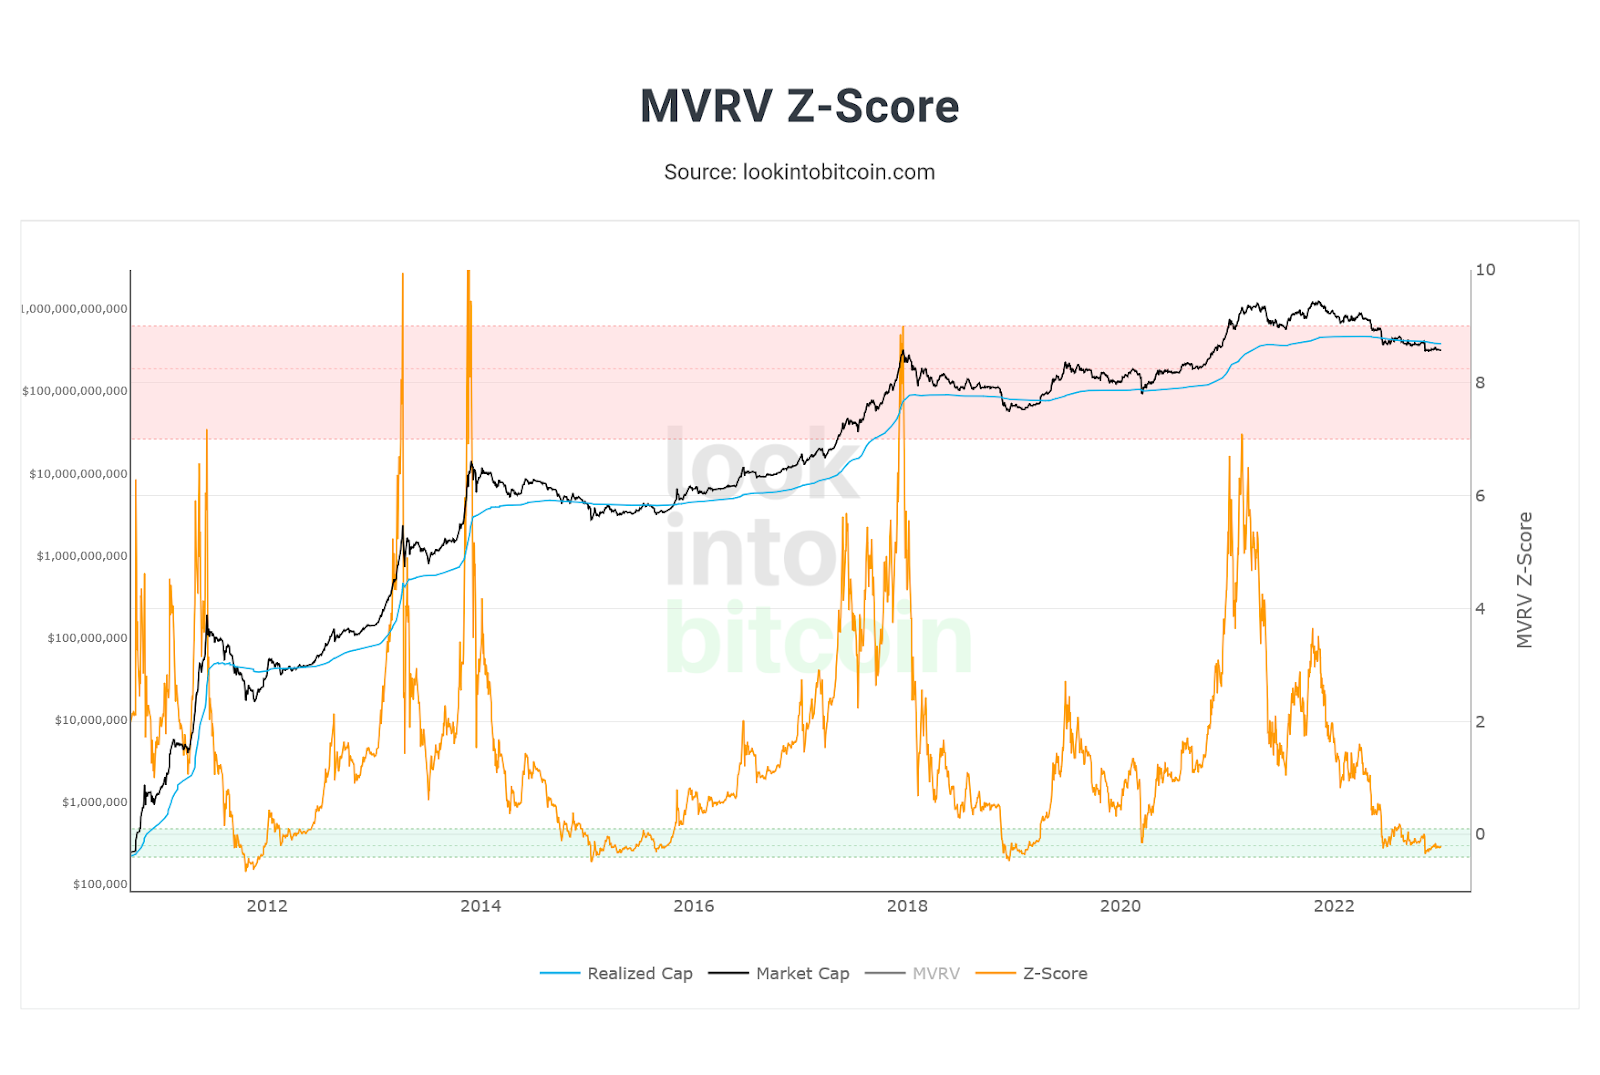
MVRV is a measure that compares the market value of Bitcoin to its realised value. Market cap (the black line) is the total value of all bitcoins in circulation, calculated by multiplying the current Bitcoin price by the number of coins in circulation. Realised cap (blue line) is the sum of the most recent selling price of every bitcoin in circulation. This is calculated by adding up the most recent sale price of each bitcoin that has been mined and moved to a different wallet address.
The MVRV Z-Score can help you determine where Bitcoin is in a bear market and when a market bottom may be around the corner. When the MVRV Z-Score (orange line) drops below zero and enters the green box, it suggests that Bitcoin is trading below its fair value and may be a good buy. Allied to this, the points where the market cap is below the realised cap have historically represented the depths of the bear market in terms of price.
When the MVRV Z-Score leaves the green and begins trending upwards again, and the market cap crosses back above the realised cap, we can assume that the bear market is coming to an end.
- 2-year MA Multiplier
The second cryptocurrency indicator we can use to help us see whether Bitcoin is exiting a bear market is the 2-year Moving Average (MA) Multiplier:
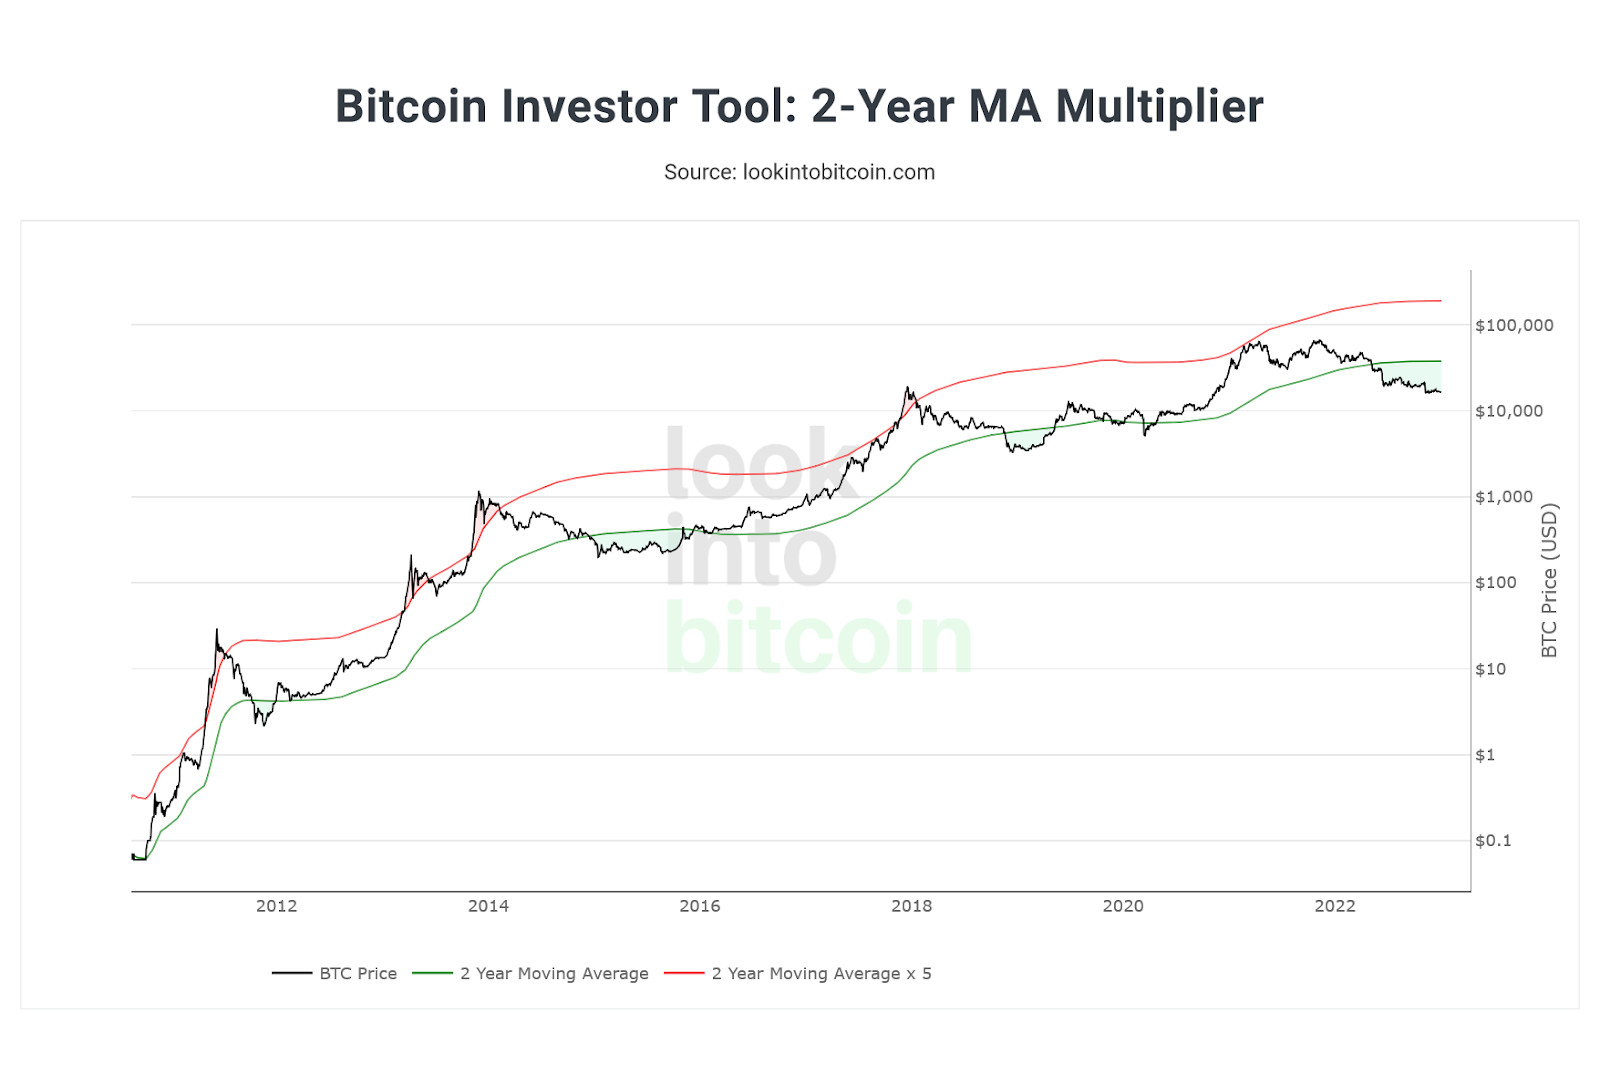
The 2-year MA Multiplier uses a moving average line, called the 2-year MA, and also a multiplied version of that line, called the 2-year MA x 5. A moving average is simply a graphical representation of Bitcoin’s price movement during the time period chosen. The x 5 multiplication is applied to the price values of the 2-year MA, not to its time period.
According to the chart, buying when the Bitcoin price (black line) drops below the 2-year MA (green line) has represented good returns, as it indicates that prices are near their ultimate lows. We can say that a market bottom has been and gone when the price line begins to move up towards the 2-year MA, but a bear market cannot be considered to be completely over until it has crossed back above it and remained so for an extended period.
- Percent Supply in Profit
The final piece of Bitcoin chart analysis we’re going to look at is the ‘Percent Supply in Profit’ chart:
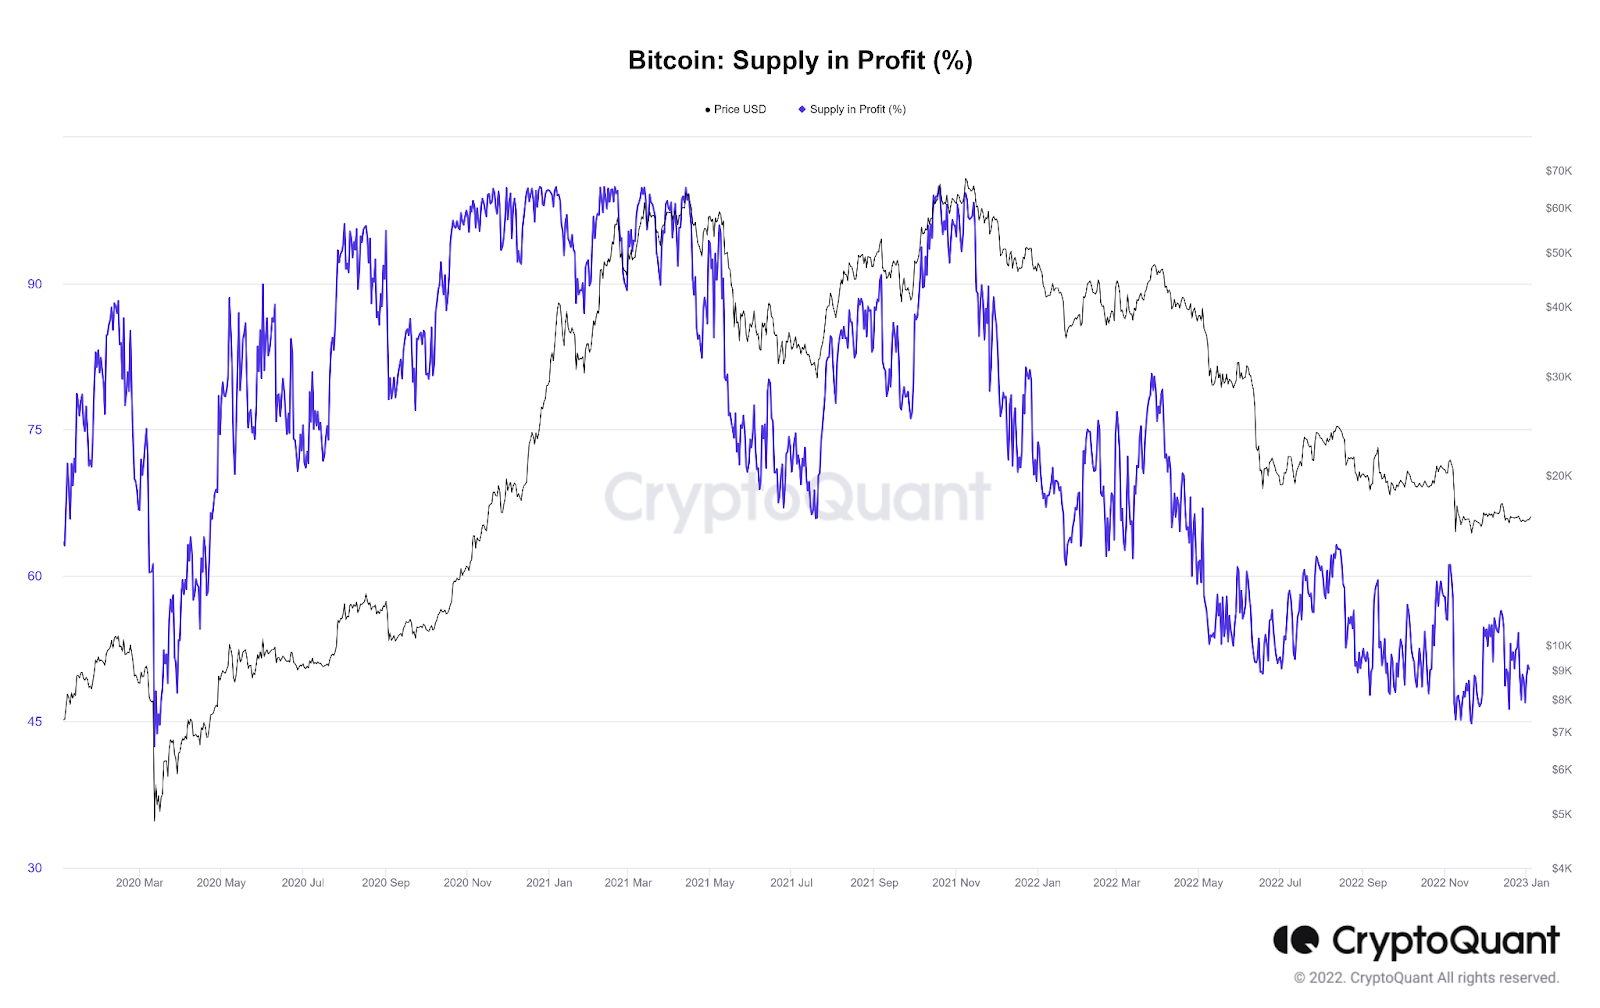
The Percent Supply in Profit chart is a metric that indicates the percentage of Bitcoin’s total supply that is currently in profit. The calculation is quite simple – dividing the absolute supply in profit by the total circulating supply and converting it to a percentage, which leaves us with a clear indicator of the profitability of all the bitcoin in circulation.
When the Bitcoin price (black line) is lower than the Supply in Profit (purple line) it reflects a bull market trend, with the reverse holding true for a bear market. A high value (above 95%) suggests that the market is at a top, while a low value (below 5%) indicates that a market bottom is at hand.
When looking for signs that a bear market is over, we’re looking for a return to an upward trajectory for the Supply in Profit line, although a bull run wouldn’t be confirmed until the Supply in Profit crosses back above the Bitcoin price.

On-chain indicators that can provide insight into when a crypto bear market might be coming to an end:
- Active addresses: Active addresses are a measure of the number of unique addresses that have sent or received transactions on the blockchain within a certain time frame. During a bear market, the number of active addresses tends to decline as investors become less active. However, when the bear market is nearing its end, the number of active addresses may start to rise again as investors begin to re-enter the market.
- Exchange inflows/outflows: Tracking the amount of cryptocurrency flowing into and out of exchanges can provide insight into market sentiment. During a bear market, there may be more cryptocurrency leaving exchanges as investors withdraw their funds. However, when the bear market is ending, there may be more cryptocurrency flowing back into exchanges as investors look to buy back into the market.
- Miner activity: Miner activity can also provide insight into market trends. During a bear market, mining activity may decline as miners become less profitable. However, when the bear market is ending, miner activity may start to rise again as miners become more profitable and start to reinvest in their operations.
- Stablecoin supply: Stablecoins, which are cryptocurrencies pegged to a stable asset like the US dollar, are often used by investors to hedge against market volatility. During a bear market, the supply of stablecoins tends to rise as investors seek to reduce their exposure to the market. However, when the bear market is ending, the supply of stablecoins may start to decline as investors become more confident in the market and start to invest again.
When Will the Bear Market End?
Unfortunately, while cryptocurrency indicators like these are great at telling us what has happened, they cannot predict what will happen. To this end, even the best crypto indicator can’t tell us when a Bitcoin bear market will end, although it is important to note that all the indicators above are suggesting that a market bottom is nigh.
Historically, Bitcoin bear markets have tended to last between around 18 months and two years, which theoretically gives us at least another five months to endure before things potentially begin to turn around.
However, Bitcoin has never experienced a bear market at a time of such rampant inflation and reduced free capital. This reduction means that Bitcoin will probably take a little longer than usual to become a desirable and affordable asset, but when the tide turns and people are able to buy risk-on assets again, these three crypto indicators will be your best guide to let you know when the time is right to press that green ‘buy’ button!
Now you can press a blue button below to start a crypto advertising campaign right now!
Launch ad campaign!Related Posts