

A browser game with 5M+ players connected an AI agent to its Bitmedia campaign through the API. Within 72 hours of the fixes it recommended, every remarketing dollar returned $7.30, and every acquisition dollar brought 2.2× more signups.
Key results of the campaign
7.3×
Return on ad spend in remarketing: $7.30 back for every $1
10 days after vs 10 days before Oct 2
+23%
Revenue per $1, on 55% less spend
10 days after vs 10 days before Oct 2
+67%
Click-through rate, same remarketing group
10 days after vs 10 days before Oct 2
+46%
Click-through rate, retention group (+33% in the first-payment group)
Oct 10 to 12 vs Sep 22 to Oct 5
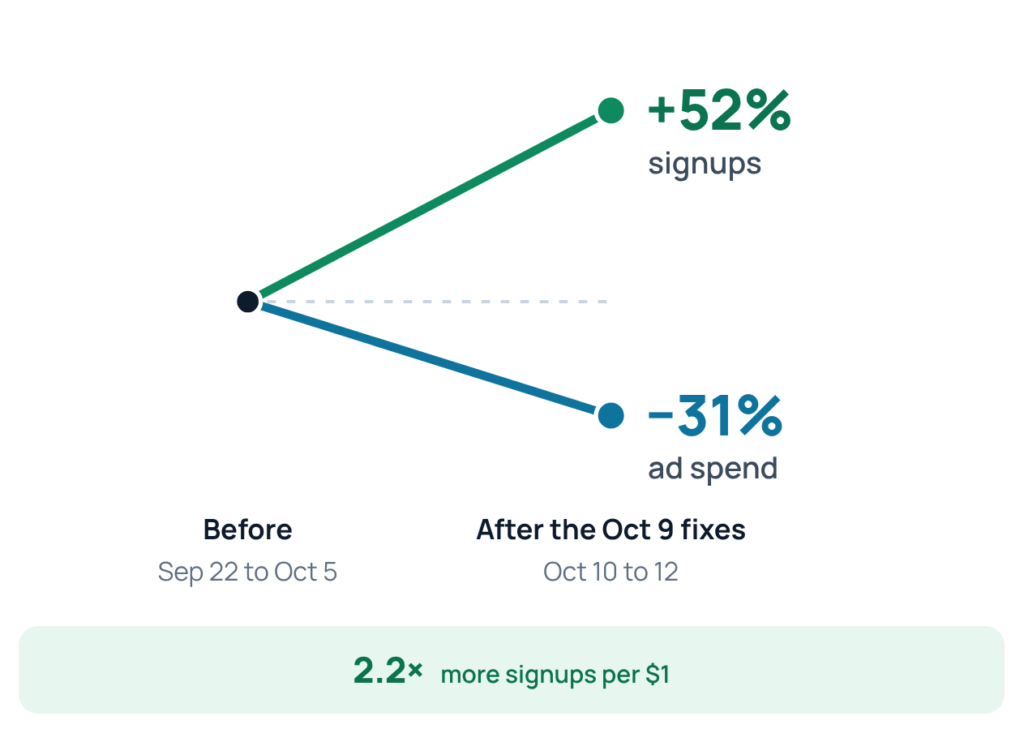
2.2×
Signups per $1, acquisition group
First 72 hours after the Oct 9 fixes vs the 14 days before
−55%
Cost per signup
First 72 hours after the Oct 9 fixes vs the 14 days before
−100%
Spend on 11 dead sites and 6 low-value countries
First 72 hours after the Oct 9 fixes
90% → 0.1%
Share of one remarketing budget spent on the game’s own website
10 days after vs 10 days before Oct 2
Before and after
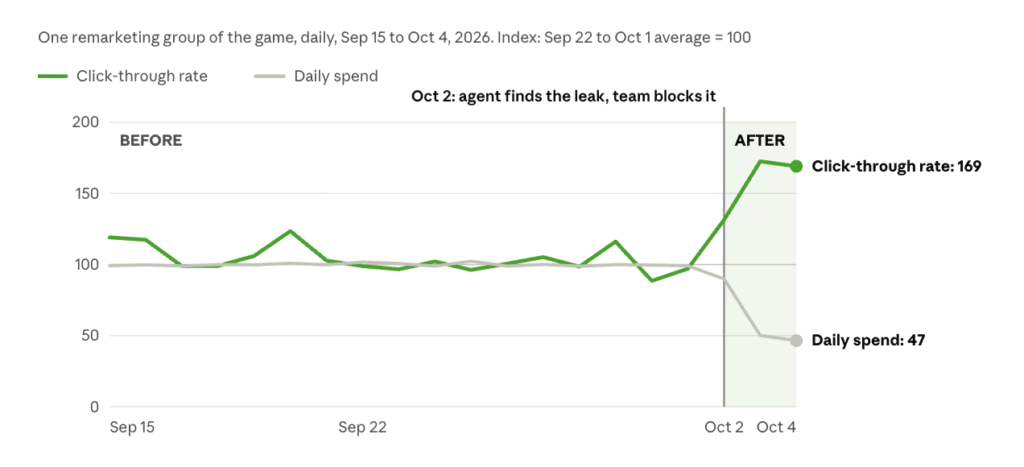
The line marks Oct 2, when the agent flagged the leak and the team blocked it the same day. Spend dropped at once, and click-through rate climbed.
Every $1 in remarketing now brings back $7.30
Ad spend vs attributed revenue per $1, from the game’s analytics (player payments plus offer revenue, last touch)
- Ad spend
- Attributed revenue
10 days before the block
10 days after the block
This is the cost vs return view, per dollar: the grey bar is $1 of spend, the green bar is what it brought back.
About the game
The client is a free-to-play browser game with 5M+ players worldwide. It has run for several years and earns from in-game purchases and offers.
Campaign overview
- Client
- Free-to-play browser game, 5M+ players
- Industry
- Gaming
- Goal
- More signups and paying players per dollar, less wasted budget
- GEO
- Worldwide, 150+ countries
- Ad groups
- 1 acquisition group and 3 remarketing groups
- Scale
- Six months of data, 540+ banners, nearly 12M impressions in the last 31 days alone
- Agent
- Claude, Anthropic’s AI model, through the Bitmedia API
- Timeline
- Oct 2 to Oct 13, 2026
- Who applied the changes
- The game’s marketer, in the Bitmedia cabinet
The challenge: the dashboard looked fine
The campaign was profitable on paper, so nothing looked broken. The leaks were hidden in breakdowns no one has time to read by hand: 200+ sites per group, 150+ countries and hundreds of banners, day by day.
The game’s team wanted an answer to one question: where is the budget going that does not come back? Instead of exporting spreadsheets, the team handed the question to an AI agent.
How the AI agent worked
The whole loop took 11 days, from the API key to verified results. No code and no developer were involved.
-
Connect (Oct 2)
The marketer gave Claude a Bitmedia API key and the game’s signups and payments export. The agent made read calls only.
-
Audit (Oct 2 to 5)
It pulled six months of stats by group, site, country, banner and device through 21 API endpoints. Then it joined them with the game’s own analytics. Every breakdown matched the group totals to the cent.
-
Recommend (Oct 5 to 9)
It ranked six fixes by impact. The marketer applied them in the Bitmedia cabinet on Oct 2, 6 and 9.
-
Verify (Oct 13)
It re-pulled five weeks of data in about 5 minutes (around 360 API calls). It checked every change in the cabinet settings and measured the results.
The agent read the data, found the leaks, ranked the fixes and checked the results. The game’s marketer made every change. Bitmedia’s API also has write actions, so your team can let an agent apply the changes you approve.
What the agent found and fixed
The agent found four leaks. The biggest showed up on day one: a remarketing group was paying to show ads to people who were already playing the game.
- 01
Leak the agent found
One remarketing group spent 85 to 90% of its budget on the game’s own website, which also runs Bitmedia ads. Almost every payment it was credited with came from people already on the site.
Fix
Blocked that placement the same day, Oct 2
Result
Budget share there: 90% → 0.1%. Revenue per $1 +23%, CTR +67%
- 02
Leak the agent found
One site grew from 4.5% to 46% of acquisition spend. Its CTR was about 6× a typical site, yet it brought almost no signups: accidental taps.
Fix
Rebalanced the site list, Oct 9
Result
Spend there −52%. The 4 best sites doubled their share, 15% → 30%
- 03
Leak the agent found
11 sites brought zero signups in 30 days, and 6 countries brought almost none.
Fix
Blocked the sites and excluded the countries, Oct 9
Result
Spend there −100%
- 04
Leak the agent found
Frequency caps counted per banner, not per person. With 7 banners, one person could see up to 70 ads a day.
Fix
Caps switched to per group, plus new offer and game banners, Oct 6 and 9
Result
CTR +46% in the retention group, +33% in the first-payment group
Why spending less was the win
Spend in the remarketing group fell 55%, and that is good news. The money that disappeared was buying clicks from people who were already playing. What stayed works harder: every $1 now brings $7.30 instead of $5.90, and the CTR is up 67%.
The acquisition group shows the same pattern. Daily spend fell 31%, yet signups per day rose 52%, because the budget moved from dead sites to the ones that convert.
Fast, and you can check it
The first leak was found and blocked on the same day. Results were measurable 72 hours after the main fixes, and a full re-check took the agent 5 minutes.
Same day
first leak found and blocked
72 hours
from fixes to results
5 min
for a full re-check
How we measured: Remarketing figures compare the 10 days after with the 10 days before the Oct 2 block. Acquisition figures compare the first 72 hours after the Oct 9 fixes (Oct 10 to 12) with Sep 22 to Oct 5. Revenue is attributed by the game’s analytics: player payments plus offer revenue, last touch. One campaign; your results will depend on your traffic.
Try it on your campaigns
Any Bitmedia advertiser can run the same audit in three steps, with Claude, Codex or any AI agent that can use an API.
Copy your API key from your Bitmedia account. If API access is off, your personal manager switches it on.
Give it to your AI agent, together with your own signups and revenue export for sharper results.
Paste this prompt and approve the fixes you like.
Prompt
Here is my Bitmedia API key and my signups and revenue export. Audit my campaigns, find wasted spend and rank the fixes by impact. Ask me before you change anything.
Start with one API key.
Launch on Bitmedia, plug in your AI agent and watch every dollar work harder.

Related Posts