Influencer marketing metrics matter because they turn guesswork into insight, they help brands distinguish which creator partnerships actually move the needle (reach, engagement, conversions) versus those that merely generate vanity numbers.
Without robust metrics, marketers risk overinvesting in influencers with large followings but low impact. As studies show, source credibility and alignment with brand values often drive conversion more than sheer audience size.
Beyond short-term performance, metrics also illuminate the long-term value of influencer relationships, including sustained audience growth, sentiment, and brand loyalty, which are harder to see if you only track immediate clicks or sales. Moreover, by using proper attribution models and tracking mechanisms (like UTM links, promo codes, multi-touch attribution), brands can connect influencer influence to revenue, optimizing budget allocation and proving ROI.
Finally, focusing solely on short-term metrics can lead to distorted decisions and undermine authenticity – a recent critique warns that an overemphasis on immediate engagement or sales may erode trust and ignore the broader brand-building potential that influencers bring.
Common mistakes in measuring influencer marketing
One of the biggest mistakes brands make is focusing only on surface-level metrics like likes, comments, or follower count. While these numbers look impressive, they rarely tell the full story of an influencer’s real impact. A creator with a smaller but highly engaged and relevant audience can drive far better results than one with a massive but disengaged following.
Another common pitfall is ignoring audience authenticity and alignment. Buying fake followers or engaging with bots can inflate numbers, but it destroys credibility and ROI. Marketers should analyze the influencer’s audience quality, demographics, and sentiment, not just their reach.
Brands also tend to measure success too narrowly, tracking engagement but neglecting conversions, web traffic, or brand lift. Without connecting influencer activity to tangible business goals, it’s impossible to know what truly works.
Finally, failing to track over time is a major oversight. Influencer marketing often generates long-term value, such as improved trust or recurring sales, that doesn’t show up in immediate campaign metrics.
In short, effective measurement means going beyond vanity metrics to assess authentic engagement, alignment, and outcomes that contribute to real brand growth.
Setting campaign goals
Before diving into metrics, you need to define what success actually looks like for your influencer campaign. Without clear objectives, even the best data will lack context. As Meltwater puts it, “you can’t measure what you haven’t defined.”
Clear goals serve as a north star for influencer selection and KPI tracking. They determine which metrics matter most, how performance will be evaluated, and whether the investment was worthwhile.
For example:
- Brand awareness – Track reach, impressions, share of voice, and growth in branded searches.
- Engagement – Focus on engagement rate, comment quality, shares, and saves.
- Traffic – Measure clicks, website sessions, referral traffic, and click-through rate (CTR).
- Leads or sales – Monitor conversions, cost per acquisition (CPA), ROI, and revenue generated.
- Reputation & trust – Assess sentiment analysis, brand mentions, and Net Promoter Score (NPS).
Each goal corresponds to a specific set of KPIs. If your aim is awareness, tracking conversions too early may distort results; if it’s sales, impressions alone won’t prove success.
In short, your goals define your metrics. Establishing them upfront allows you to align influencer deliverables, content formats, and reporting structures to the outcomes that matter most to your brand.
Types of influencer marketing metrics
Effective influencer marketing measurement requires a funnel-based approach. Each stage, from awareness to conversion, uses different metrics that capture how audiences interact with your brand. Understanding where each metric fits helps you evaluate performance holistically rather than in isolation.
a. Awareness & Reach metrics
These top-of-funnel metrics show how many people were exposed to your influencer content. They don’t measure engagement or conversions directly but indicate your campaign’s visibility and audience scale.
- Reach – The number of unique users who saw an influencer’s post or story. High reach means strong visibility but doesn’t guarantee action.
- Impressions – The total number of views a post receives, including multiple views from the same user. It helps assess message frequency.
- Share of Voice (SOV) – Your brand’s visibility compared to competitors across all influencer mentions. SOV = (Brand Mentions / Total Mentions in Category) × 100.
- Brand mentions – The number of times your brand or hashtag appears across influencer content and user comments. Great for brand lift analysis.
- Growth in branded searches – Monitors whether people start searching your brand name more frequently after the campaign, often using Google Trends or Search Console.
Goal: Measure the effectiveness of your influencer campaign in expanding visibility and recall.
b. Engagement metrics
Engagement metrics move beyond exposure to show how audiences interact with the content. They help gauge authenticity, interest, and emotional connection.
- Likes, comments, shares, saves – Indicate audience response and the type of engagement (e.g., saves often mean long-term interest).
- Engagement Rate (ER) – ER = (Likes + Comments + Shares) / Followers × 100
This normalizes engagement across influencers of different sizes. - Quality of interactions – Not all engagement is equal. Analyze the tone and relevance of comments, authentic discussions outweigh generic emojis.
💡 Tip: Micro-influencers often deliver higher engagement rates than celebrities due to niche, loyal audiences.
Goal: Evaluate the content’s appeal and relevance to the target audience.
c. Audience quality & Sentiment metrics
Audience quality determines whether an influencer’s followers actually match your target demographic. Sentiment metrics show how people feel about your brand.
- Audience growth – Changes in followers or subscribers during and after a campaign. Sustained growth signals ongoing interest.
- Demographics and interests – Key indicators such as age, gender, location, and hobbies—verify alignment with your buyer persona.
- Audience authenticity – Tools like HypeAuditor or Modash help detect fake followers or engagement bots.
- Sentiment analysis – Classifies user-generated content as positive, neutral, or negative. Useful for reputation management.
- Brand reputation mentions – Monitors tone trends in user discussions to identify perception shifts or crises early.
Goal: Make sure that your campaign is reaching the right audience and maintaining a positive emotional connection.
d. Traffic & Web performance metrics
These mid-funnel metrics link influencer activity to website behavior and deeper audience engagement. They’re especially important for e-commerce or SaaS brands.
- Clicks and Click-Through Rate (CTR) – CTR = (Clicks / Impressions) × 100 – shows how compelling the influencer’s CTA is.
- Unique visitors – Number of distinct users coming from influencer channels.
- Sessions, Average time on site, Pages per session – Reveal user interest and browsing behavior – are they exploring or bouncing quickly?
- Bounce Rate – Percentage of visitors who leave after viewing one page; high rates may indicate poor landing page experience.
- UTM Tracking & Referral Traffic – Unique UTM parameters help identify which influencer or post drives the most qualified traffic.
Goal: Quantify how effectively influencers convert attention into active website exploration.
e. Conversion & Revenue metrics
At the bottom of the funnel, these metrics demonstrate real business impact. They connect influencer activity to measurable outcomes like leads, purchases, or revenue.
- Conversion rate – The percentage of users who take a desired action (e.g., purchase, signup) after clicking influencer content.
- Leads or signups – Total new customers or subscribers acquired from influencer campaigns.
- Direct Sales & revenue – Tracked via promo codes, affiliate links, or dedicated landing pages.
- ROAS (Return on Ad Spend) – Revenue generated / Campaign cost. Indicates profitability.
- ROI (Return on Investment) – (Net Profit / Total Investment) × 100. A holistic measure of campaign success.
- CPA (Cost per Acquisition) – Cost per new customer—helps compare influencers by efficiency.
- CLV (Customer Lifetime Value) – Predicts the long-term value of new customers acquired through influencer efforts.
- Incremental Sales – Additional revenue attributed directly to influencer exposure, beyond organic growth.
- Earned Media Value (EMV) – Estimates the dollar value of organic impressions and engagement if they were paid ads. The formula varies by platform (e.g., impressions × CPM rate).
Goal: Connect influencer activities to bottom-line business outcomes and prove ROI.
✅ Pro Tip. The best influencer programs combine metrics from multiple funnel stages—e.g., using reach and sentiment for brand awareness, engagement for mid-funnel validation, and conversions for ROI. Tracking the full customer journey gives the most accurate picture of impact.
Attribution and Tracking methods
Why last-click attribution doesn’t work well for influencer campaigns
Traditional last-click attribution gives 100% of the credit for a conversion to the final touchpoint before a sale. While this method is simple, it fails to capture the full customer journey typical of influencer marketing. Influencers often drive awareness and consideration rather than immediate conversions — meaning their true impact happens earlier in the funnel. Relying solely on last-click metrics undervalues the influencer’s contribution and can mislead budget allocation decisions.
Smarter attribution models for influencer campaigns
To better understand how influencers change the buyer journey, marketers use multi-touch attribution models that distribute credit across several touchpoints:
- Linear attribution. Gives equal credit to every interaction in the customer journey.
- Time-decay attribution. Assigns more credit to interactions closer to the conversion event, useful for long campaigns.
- Position-based (U-shaped) attribution. Splits credit between the first and last interactions, acknowledging both awareness and conversion roles.
- Data-driven or multi-touch attribution. Uses algorithms to determine the actual contribution of each touchpoint based on real performance data.
Each model provides a more nuanced view of how influencers contribute to outcomes such as brand lift, engagement, and eventual sales.
Practical tracking techniques
To measure influencer impact accurately, combine attribution modeling with practical tracking tools and methods:
- UTM parameters. Add tagged links (e.g., ?utm_source=instagram&utm_medium=influencer&utm_campaign=springlaunch) to track which influencer and post generated traffic in Google Analytics.
- Unique promo codes. Custom discount codes per influencer (e.g., “NATALIE10”) allow you to trace conversions and revenue to specific creators, even without link clicks.
- Affiliate links. Special trackable URLs tied to commissions; ideal for performance-based influencer campaigns.
- Tracking pixels and retargeting. Embed pixels (Meta, TikTok, Google) to monitor post-engagement behavior, retarget warm audiences, and measure conversions influenced by previous content exposure.
Linking influence to delayed conversions
Influencer-driven conversions often occur days or weeks after initial exposure. To connect these delayed actions to influencer efforts:
- Monitor assisted conversions in Google Analytics or attribution platforms.
- Compare baseline sales before and after influencer content went live.
- Use view-through tracking to measure users who saw influencer content but converted later through another channel.
- Analyze search lift — increased branded search volume following influencer activity.
Together, these methods give a more holistic view of how influencers contribute to awareness, trust, and eventual sales, helping brands make data-driven decisions about future partnerships.
Tools and platforms for measuring influencer marketing metrics
| Tool/Platform | Metrics Tracked | Pros | Cons | Best Use Cases |
| Native Analytics (Instagram Insights, TikTok Analytics, YouTube Studio) | Impressions, reach, engagement, follower growth, video stats | Free, real-time, platform-specific | Limited cross-platform comparison, audience insights are shallow | Monitoring individual influencer posts, platform-level performance |
| Google Analytics (GA4) | Website traffic, conversions, user behavior, referral sources, ROI | Tracks multi-channel attribution, measures on-site impact | Needs UTM setup, not influencer-specific, without proper tagging | Measuring traffic & sales driven by influencers, conversion tracking |
| Influencer Marketing Platforms (Meltwater, Hypefy, Aspire) | Engagement, reach, EMV, ROI, influencer effectiveness | Centralized campaign management, detects fake followers, reporting templates | Paid tools, dependent on influencer account access | Managing multiple influencer campaigns, performance comparisons, ROI calculations |
| Social Listening Tools (Brandwatch, Mention, SproutSocial) | Brand mentions, sentiment, hashtags, competitor activity | Measures indirect impact, monitors audience sentiment | Less precise for direct conversions, can be expensive | PR monitoring, hashtag tracking, sentiment analysis, brand awareness |
| Dashboards & BI Tools (Looker Studio, Tableau, Power BI) | Custom metrics from multiple sources, visual analytics, trend analysis | Highly customizable, combines multiple data sources, automated reports | Requires setup & technical knowledge, connectors may need configuration | Cross-platform reporting, executive dashboards, trend visualization |
Structuring your reports – Campaign-level vs. long-term
Influencer marketing reporting should serve two complementary purposes: evaluating individual campaign performance and tracking long-term trends across all influencer partnerships.
- Campaign-level reports focus on short-term outcomes — reach, engagement, traffic, and conversions from a specific activation or content drop. These are ideal for assessing which influencers, formats, or platforms performed best in a given period.
- Long-term or quarterly reports focus on patterns — such as ROI trends, cost-efficiency (CPA, ROAS), brand sentiment, and audience growth over time. They help identify high-performing creators and refine your influencer strategy for sustained impact.
A well-structured reporting framework ensures consistency across teams and makes it easier to compare performance across different campaigns, content types, or influencer tiers.
What to Include – Key Metrics, Comparisons, and Insights
An effective influencer marketing report should go beyond raw data — it must tell a story. Include the following sections for actionable insights:
- Overview / Executive Summary
Brief description of the campaign, goals, influencers involved, platforms used, and reporting timeframe.
Highlight top-performing posts or creators.
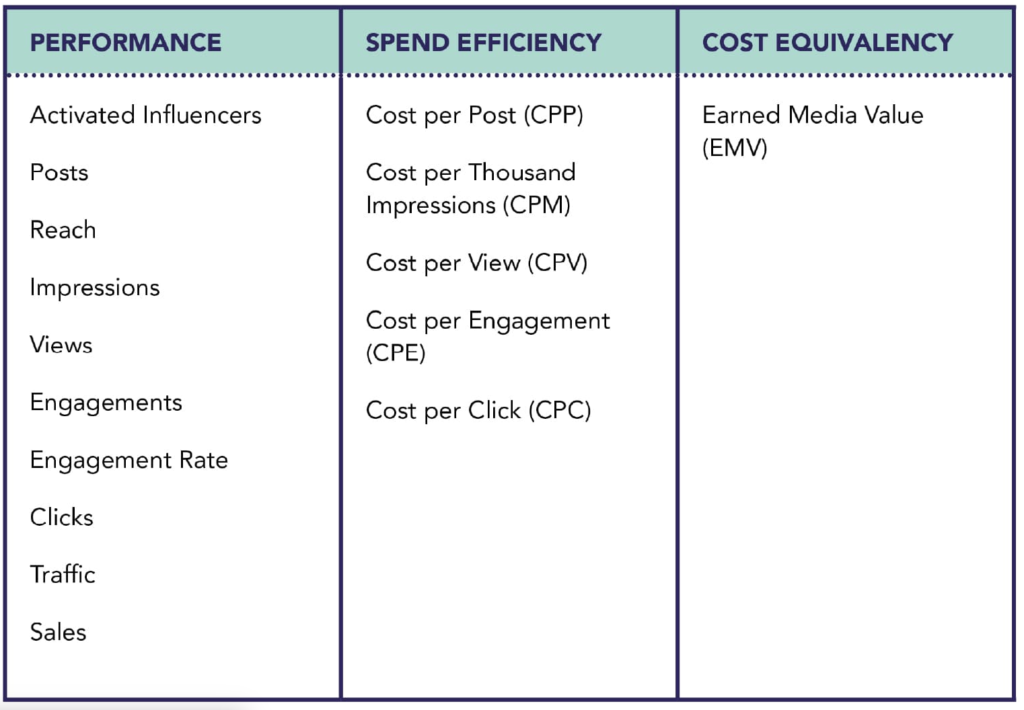
- Performance Metrics
Awareness – Reach, impressions, share of voice.
Engagement – Likes, comments, saves, engagement rate, audience quality.
Traffic & Conversion – Clicks, CTR, conversion rate, revenue, ROI.
Brand Sentiment – Positive/negative mentions, tone of comments, brand reputation changes.
- Comparisons & Benchmarks
Compare results against previous campaigns or industry averages.
Include cost-efficiency metrics (e.g., cost per engagement, cost per lead).
Highlight anomalies or trends — such as spikes in engagement tied to specific content types or posting times.
- Insights & Recommendations
Identify which influencer segments or content types drive the best ROI.
Suggest optimization opportunities: timing, content format, audience targeting.
Provide clear next steps for future campaigns.
How to present data clearly – Visuals, charts, and tables
Data visualization transforms complex metrics into clear, intuitive insights. Use visuals that highlight trends and relationships at a glance:
- Bar and column charts for comparing influencer performance or platform results.
- Line graphs to track growth over time (followers, reach, CTR).
- Pie charts or stacked bars to visualize audience breakdowns or sentiment distribution.
- Tables for detailed KPI summaries and cost-performance ratios.
- Heat maps or scorecards for ranking top-performing influencers or posts.
Make visuals interactive when possible (in dashboards like Google Data Studio, Power BI, or Looker Studio) to allow stakeholders to filter data by influencer, campaign, or date range.
Example reporting templates
You can use or adapt these structures for consistent influencer performance reporting:
1. Campaign performance snapshot (Excel / Google Sheets)
| Metric | Influencer | Platform | Value | Benchmark | Notes |
| Reach | @username | 85,000 | +10% vs avg | Top-performing post | |
| Engagement Rate | @username | TikTok | 4.5% | Industry avg: 3% | Excellent interaction quality |
| CTR | @username | YouTube | 2.1% | +0.5% vs prev. campaign | Strong CTA execution |
2. Long-term performance dashboard (Looker Studio / Power BI)
- Monthly Reach & Engagement Trends
- Influencer Tier Performance Comparison (Micro vs. Macro)
- Cost vs. ROI Visualization
- Sentiment & Brand Health Over Time
Tip: Combine quantitative metrics with qualitative insights (comments analysis, influencer feedback, or content tone). This hybrid approach confirms that your report tells not just what happened — but why it happened, helping stakeholders make informed decisions.
How to “Read” influencer performance data
Collecting data is only the first step — the real value comes from interpreting it correctly. Influencer performance data should always be viewed in context, not isolation. For example, a high engagement rate may look impressive, but if it comes from an audience outside your target demographic, its business value is limited.
When reviewing metrics, focus on three layers of insight:
- Quantitative performance — numerical results such as reach, engagement, clicks, or conversions.
- Qualitative signals — tone of comments, content quality, alignment with brand values.
- Comparative trends — how each influencer’s results compare to benchmarks, previous campaigns, or peers in the same niche.
Combining these perspectives helps distinguish vanity metrics from indicators of true influence.
Identifying truly effective influencers
An influencer’s real effectiveness goes beyond audience size. Look for consistent performance across multiple campaigns, high-quality engagement, and the ability to drive measurable actions. Key indicators of a high-impact influencer include:
- Authentic audience connection: Comments reflect genuine interest or trust rather than spammy interactions.
- Strong content alignment: The influencer’s tone, visuals, and values fit seamlessly with your brand’s messaging.
- Conversion consistency: Even if conversion volumes vary, the influencer repeatedly contributes to assisted conversions or long-tail brand lift.
- Cross-platform influence: The creator maintains engagement and impact across multiple social channels.
- Efficient cost metrics: Low cost per engagement (CPE), click (CPC), or acquisition (CPA) relative to campaign averages.
Building long-term partnerships with such creators yields a stronger ROI than one-off collaborations with larger but less engaged accounts.
When engagement ≠ conversions
A frequent challenge in influencer marketing is high engagement but low conversion rates. This doesn’t necessarily mean the campaign failed — it may indicate a gap between interest and action. Common causes include:
- Misalignment between audience and product: The influencer’s followers enjoy the content but don’t match your buyer profile.
- Weak call-to-action (CTA): The message may lack urgency, clarity, or direct purchase incentive.
- Friction in conversion path: Poor landing page experience, too many clicks to purchase, or missing mobile optimization.
- Upper-funnel influence: The influencer built awareness or trust, but the conversion happens later through retargeting or organic search.
To diagnose this, analyze assisted conversions, referral traffic behavior, and brand search growth following the campaign. Then decide whether to optimize creative messaging, funnel design, or audience targeting.
Optimization based on data insights
Once you’ve interpreted the results, turn insights into actions:
Refine Influencer Selection
- Prioritize creators with proven engagement quality, demographic fit, and historical ROI.
- Test different influencer tiers (nano, micro, macro) to balance cost and reach.
Optimize Content Strategy
- Identify which formats (reels, tutorials, testimonials) drive better results.
- Repurpose high-performing influencer content in paid ads or remarketing.
Adjust Funnel and Messaging
- Improve CTAs, landing pages, and incentives for smoother conversion paths.
- Align influencer storytelling with campaign objectives (e.g., awareness vs. sales).
Iterate and Benchmark
- Compare new campaign data with previous periods to measure improvement.
- Use continuous testing (A/B or multivariate) to find optimal combinations of influencer, content, and platform.
When interpreted effectively, influencer marketing data becomes a feedback loop — helping you make smarter budget decisions, deepen partnerships with top creators, and continuously improve campaign ROI.
Challenges, limitations, and risks
1. Fake followers, bots, and engagement fraud
Influencer metrics can be inflated by non-genuine followers or automated interactions, making it difficult to assess true audience engagement and campaign effectiveness.
2. High engagement but low CTR or sales
Strong likes, comments, or shares do not always translate into meaningful actions such as clicks, conversions, or purchases, potentially limiting ROI.
3. Lagging impact (delayed influence)
The effects of influencer campaigns may not be immediate; purchases or conversions can occur weeks after content is posted, complicating attribution and performance measurement.
4. Data limitations across platforms
Each social media platform provides different analytics tools and reporting standards, making cross-platform performance comparisons challenging and sometimes inaccurate.
5. Legal and ethical risks
Non-compliance with disclosure regulations (e.g., FTC guidelines) or association with unsafe or controversial content can damage brand reputation and lead to legal consequences. Transparency and brand safety are critical considerations.
Case studies and practical examples
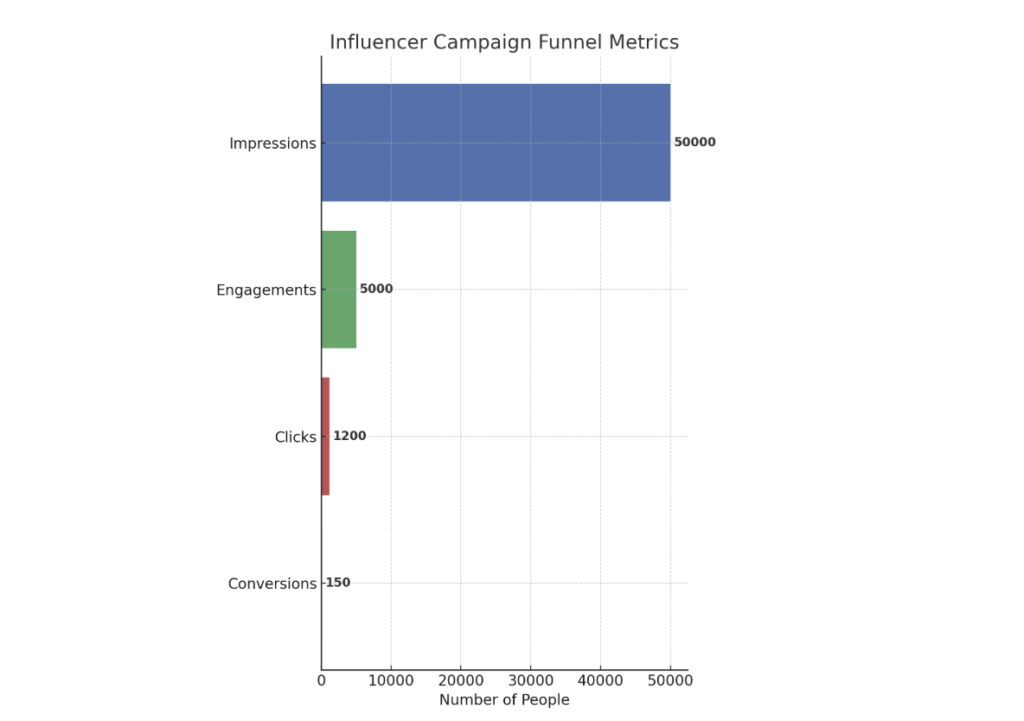
Example influencer campaign with metrics at each funnel stage
- Campaign goal: Promote a new crypto trading platform.
- Influencer type: Mid-tier crypto YouTuber (150K subscribers).
- Funnel metrics:
- Awareness: 50,000 impressions on YouTube & Instagram.
- Engagement: 5,000 likes/comments/shares (10% engagement rate).
- Consideration: 1,200 link clicks to landing page (CTR 2.4%).
- Conversion: 150 new sign-ups (conversion rate 12.5% of clicks).
This example demonstrates how engagement does not always directly correlate to conversions, highlighting the importance of tracking the full funnel.
Comparison between influencers or platforms
| Influencer / Platform | Followers/Subscribers | Avg Engagement Rate | CTR | Conversions | ROI |
| Influencer A (YouTube) | 150K | 10% | 2.4% | 150 | 3.2x |
| Influencer B (Instagram) | 200K | 5% | 1.8% | 100 | 2.0x |
| Influencer C (TikTok) | 500K | 15% | 1.0% | 50 | 1.5x |
This shows that a larger following doesn’t always mean better ROI; engagement quality and platform relevance are key factors.
Example calculations
- EMV (Earned Media Value):
EMV = Media equivalent cost × engagement multiplier
Example: $5,000 paid media × 2.0 engagement factor = $10,000 EMV - ROAS (Return on Ad Spend):
ROAS = Revenue generated ÷ Ad spend
Example: $15,000 revenue ÷ $5,000 spend = 3x ROAS - ROI (Return on Investment):
ROI = (Revenue − Cost) ÷ Cost × 100%
Example: ($15,000 − $5,000) ÷ $5,000 × 100% = 200% ROI
Step-by-Step Measurement Checklist
Here’s a compact visual checklist table for your influencer campaign measurement:
| Step | Action | Checklist |
| Define Campaign Goals | Set objectives and KPIs | ☐ Define success metrics (sales, installs, traffic) ☐ Set measurable KPIs (CTR, ROI, reach) ☐ Align with marketing objectives |
| Select Influencers | Choose the right partners | ☐ Match audience & brand values ☐ Verify followers and engagement ☐ Decide campaign type (posts, stories, giveaways) |
| Create Tracking Structure | Prepare tracking for performance | ☐ Generate UTMs for links ☐ Assign unique promo/affiliate codes ☐ Set up analytics dashboards |
| Monitor in Real-Time | Track campaign progress | ☐ Monitor clicks, impressions, conversions ☐ Identify underperforming influencers/content ☐ Check if tracking works correctly |
| Analyze and Report | Evaluate results | ☐ Compare results against KPIs ☐ Identify top-performing influencers/content ☐ Visualize data (charts, tables, funnels) |
| Optimize for Next Cycle | Apply learnings | ☐ Adjust influencer/content strategy ☐ Refine posting schedule and targeting ☐ Improve tracking methods |
Related Posts